An Unbalanced Housing Market
Mar 18, 2025
Introducing CT Housing Pulse, a new series from CHFA providing timely updates on Connecticut’s housing market. Between full Housing Needs Assessments, we’ll share key trends and data-driven insights to help you stay informed.
It’s no secret to anyone currently looking to buy a home, that the housing market feels out of balance. Limited supply, elevated prices, and higher interest rates have significantly restricted the options for homebuyers, especially first-time buyers. According to the Joint Center For Housing Studies, “In the first quarter of 2024, a household needed to earn a whopping $120,000 annually to afford the median-priced home in the US, up from an inflation-adjusted $82,000 in the first quarter of 2021, assuming a loan with a down payment of 3.5 percent and a 31 percent housing payment-to-income ratio”.
Arguably the primary cause of this imbalance is the lack of available homes for sale. According to Realtor.com data, in February 2025, the U.S. had 23% less active listings than it did in 2019. Regionally, there is significant variation in the change in active listings. As seen in the map below, states in the Sun Belt and the Great Plains are seeing listings activity above their 2019 levels. These markets have seen a slow improvement in overall affordability compared to the Northeast and Midwest where listings activity is well below 2019 levels.
The market in Connecticut is particularly tight. Connecticut had 78% fewer active listings in February 2025 than in 2019, meaning that there was only 1 home for sale in 2025 for every 5 available in 2019. Connecticut had the largest listings deficit of any state followed by New Jersey (69%), Vermont (68%), and Rhode Island (67%).
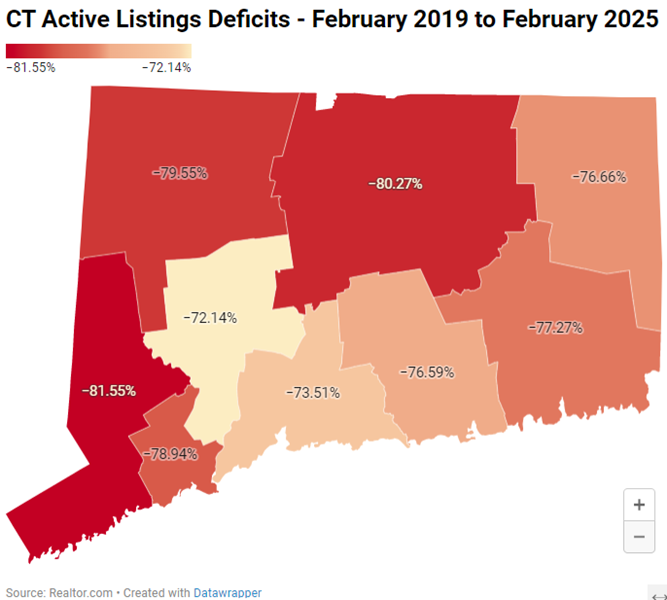
Looking more closely at Connecticut’s markets below, among the 100 largest counties in the country between February 2019 and 2025, the Capitol Region had the largest listings deficit, with just over 80% fewer listings. Connecticut’s other county-equivalents are not far behind, with the smallest listings deficit in the Naugatuck Region at just under 70%.
As homebuyers faced limited options, several market distortions began to take shape. First, homes are selling much faster than at any point in the last five years. With fewer homes on the market and continued high demand, buyers began forgoing inspections and other steps to compete against other buyers. For example, in the Hartford Metro Area in January 2025, the mean days until pending was just 30, down from 82 in January 2019.
Mean Days until Pending by Metro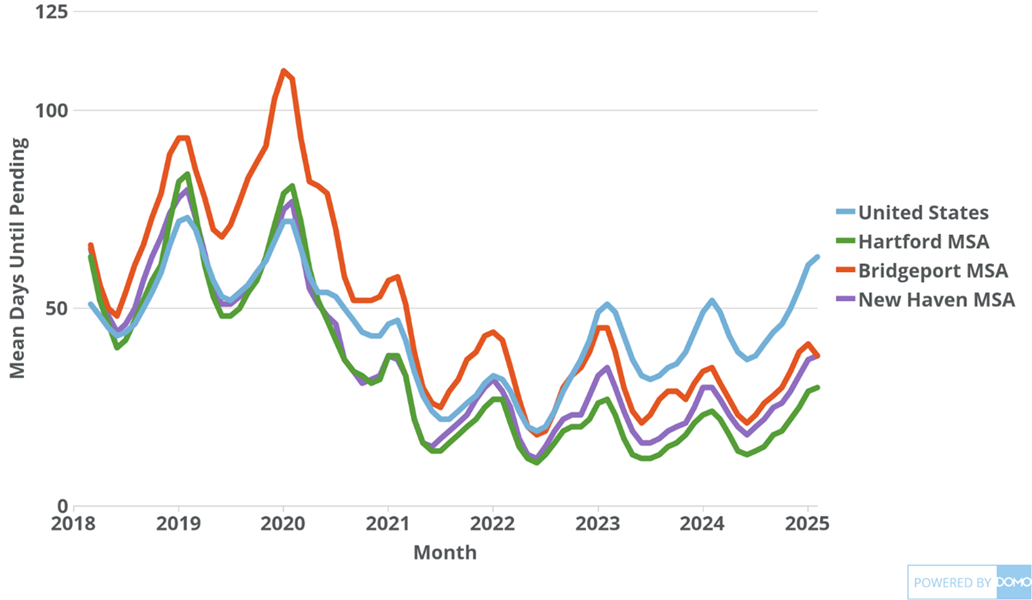 Source: Zillow
Another product of limited listings is that the homes that are on the market are selling at elevated prices. Before 2020, in Connecticut and nationally, between 15% and 25% of homes would sell above what they were listed for. As listings levels declined in 2020 and 2021, this figure increased dramatically. By mid-2022, 75% of Connecticut homes sold above list price; nationally that number was 60%. According to CHFA’s analysis of data from the Warren Group, the median sale price of a 1-to-4-unit home in Connecticut has increased from $235,000 in 2019 to $370,000 in 2024.
Percent of Homes Sold Above Listing Price
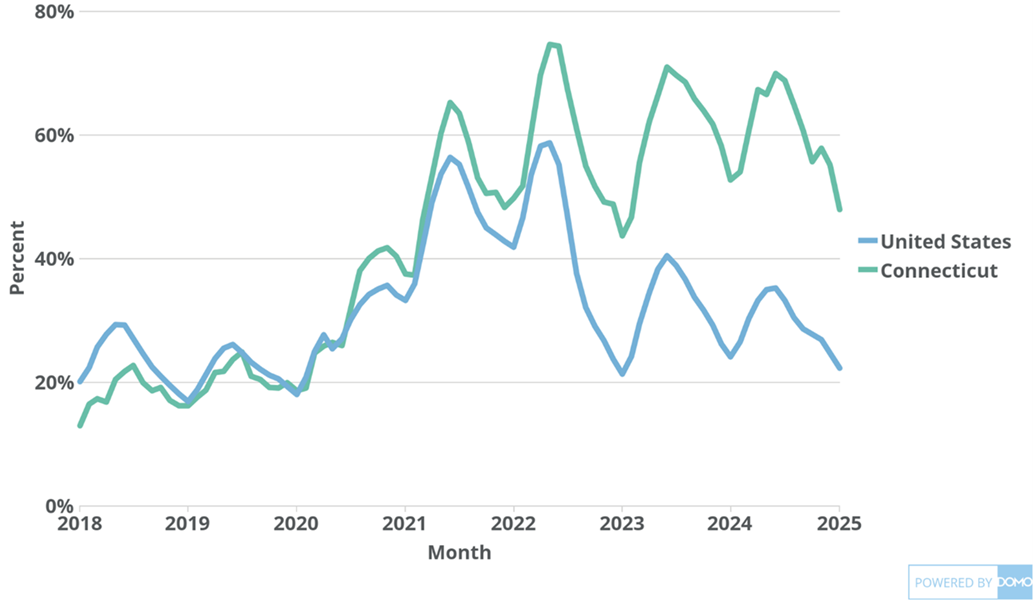
Source: Zillow
In recent months as seen below, Connecticut has seen some positive listings growth on a year-over-year basis. However, overall active listings levels are still well below where they were pre-2020.
Active Listings Count and Year over Year Change
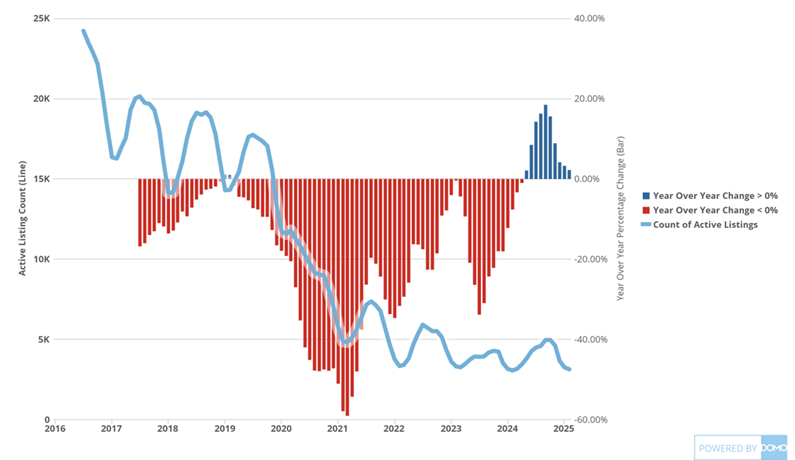
Source: Realtor.com
Recognizing how competitive the for-sale market is, CHFA offers a wide variety of programs that help first-time homebuyers access homeownership. Program’s like Time To Own and CHFA’s Down Payment Assistance Program have helped to give first-time homebuyers a chance in an unbalanced market. For first-time buyers navigating this competitive market, CHFA offers tools to make homeownership possible. Learn how programs like Time To Own and Down Payment Assistance can help at http://www.chfa.org/homebuyers/.
For a deeper understanding of Connecticut’s housing market, check out CHFA’s Housing Needs Assessment.
------------------------------------------
Andrew Bolger is a Senior Research and Data Analyst in the Connecticut Housing Finance Authority’s Research, Marketing, and Outreach Department. In this role he manages CHFA’s housing database, tracks and analyzes housing market conditions, and evaluates CHFA programs. He received a BA in Economics and Political Science and an MA in Public Policy from the University of Connecticut.